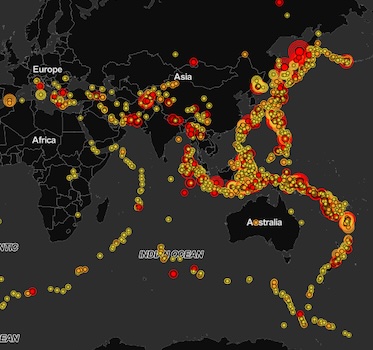
3 new & easy ways to simplify complex data visualizations
Kevin Naughten Product Manager
19th December, 2023 | 7 min read
Data overload is a real problem for busy analysts. How do they spot the red flags in a cyber security network? Or...
Kevin Naughten Product Manager
19th December, 2023 | 7 min read
Data overload is a real problem for busy analysts. How do they spot the red flags in a cyber security network? Or...
Andrew Disney Marketing Director
13th November, 2023 | 2 min read
Together with our partners at Sistemi & Automazione, we’ve secured a tender to provide Italy’s central...
Khadeja Sajjad Software Developer
9th November, 2023 | 8 min read
Analysts rely on our data visualization toolkits to spot hidden patterns in their visualized data. They...
Ivan Krushkov Commercial Developer
9th August, 2023 | 8 min read
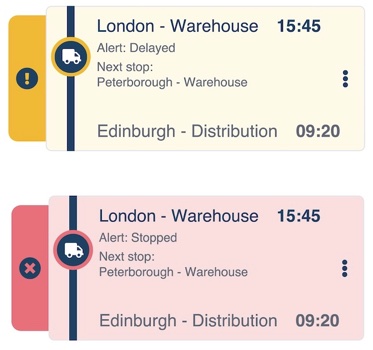
In this post, I show how easy it is to design a visual supply chain that’s customized to your users’ needs,...
Dan Williams Head of Product Management
26th July, 2023 | 6 min read
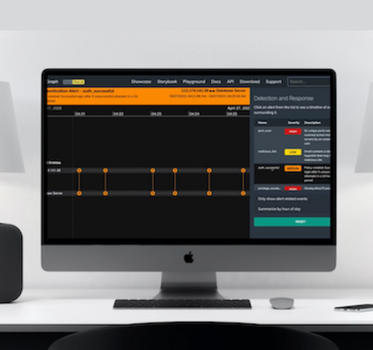
Timeline visualization gives cybersecurity analysts a scalable and intuitive way to investigate threat data, and...
Andrew Disney Marketing Director
21st June, 2023 | 6 min read
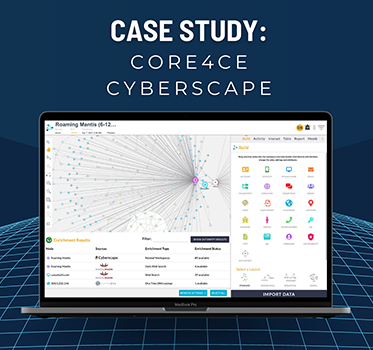
See how Core4ce use KeyLines-powered visualizations to help keep critical systems safe from cyber...
Thomas Chan
13th June, 2023 | 10 min read
This AI data visualization tutorial shows how to integrate ReGraph, our React graph visualization toolkit, with...
Dan Williams Head of Product Management
25th May, 2023 | 3 min read
As companies move their digital infrastructure to the cloud, and as Infrastructure as a Service (IaaS) becomes the...
Noah Stapleton Sales Manager
9th May, 2023 | 11 min read
How do senior management teams prioritize cyber threat detection? We look at key trends from the latest reports,...