AI data visualization tutorial: bring ChatGPT data to life
Thomas Chan
13th June, 2023 | 10 min read
This AI data visualization tutorial shows how to integrate ReGraph, our React graph visualization toolkit, with...
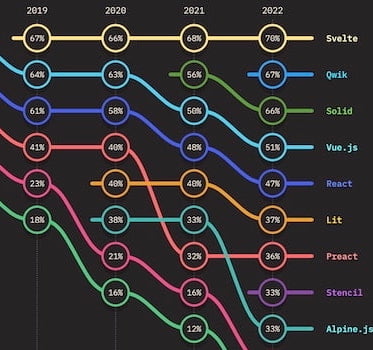
Svelte tutorial: create a super-fast app with KeyLines
Thomas Chan
17th January, 2023 | 7 min read
Svelte got top billing in the State of JS 2022 survey, so here’s a Svelte tutorial to show you how to...
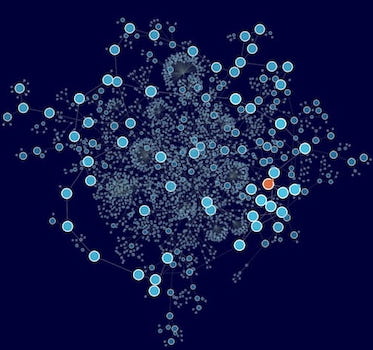
Next.js data visualization for faster graph visualization apps
Thomas Chan
26th April, 2022 | 8 min read
In this blog post, we use an app built with the ReGraph graph visualization SDK to test the latest Next.js...
Using Angular CLI to get started with KeyLines
Thomas Chan
11th February, 2022 | 5 min read
Find out how quick and easy it is to integrate Angular with KeyLines, our graph visualization toolkit for...
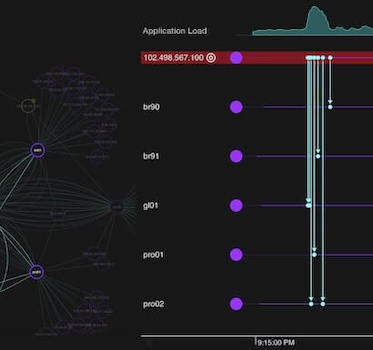
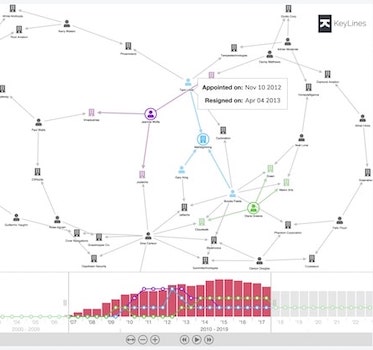
Root cause analysis with timeline & graph visualization
Thomas Chan
25th January, 2022 | 12 min read
Our updated guide to building a custom root cause analysis timeline and graph visualization app in React, with...
React Material UI data visualization tutorial
Thomas Chan
12th January, 2021 | 6 min read
Follow this React Material UI tutorial to get Material Design icons working with ReGraph and build stylish graph...
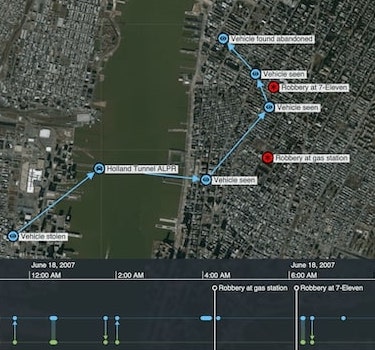
Esri ArcGIS data visualization for powerful geospatial analysis
Thomas Chan
12th February, 2019 | 7 min read
Learn how to integrate KeyLines with Esri’s open source esri-leaflet library to access their ArcGIS mapping...