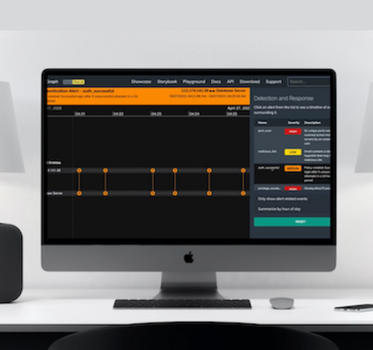
Build a cybersecurity dashboard to fight alert fatigue
Dan Williams Head of Product Management
26th July, 2023 | 6 min read
Timeline visualization gives cybersecurity analysts a scalable and intuitive way to investigate threat data, and...
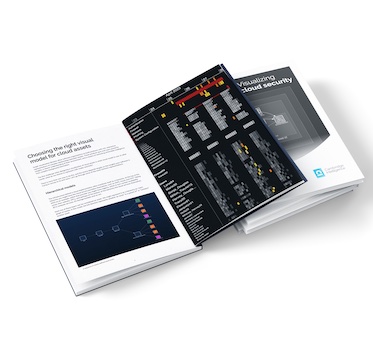
OUT NOW: Cloud security visualization white paper
Dan Williams Head of Product Management
25th May, 2023 | 3 min read
As companies move their digital infrastructure to the cloud, and as Infrastructure as a Service (IaaS) becomes the...
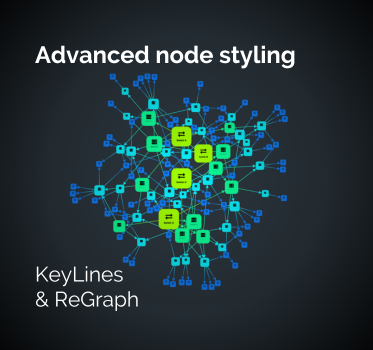
The advanced node styling users want in their graph visualizations
Dan Williams Head of Product Management
7th March, 2023 | 3 min read
KeyLines and ReGraph deliver an advanced level of node styling capability and almost limitless customization...
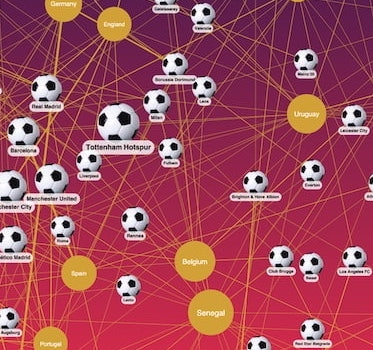
Using graph theory to make 2022 World Cup predictions
Dan Williams Head of Product Management
18th December, 2022 | 9 min read
Here’s a story about how we made World Cup predictions that (almost) came true. After our successful...
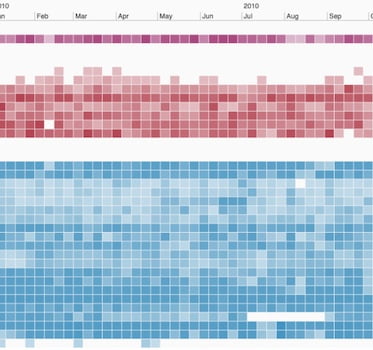
The ultimate guide to timeline data modeling
Dan Williams Head of Product Management
16th August, 2022 | 8 min read
Want to know how to do timeline data modeling? We explore best practices with real-world examples of the best...

Product update: coding playground & testing APIs
Dan Williams Head of Product Management
31st May, 2022 | 2 min read
The latest updates to our graph visualization toolkits include new testing APIs and a live-coding...

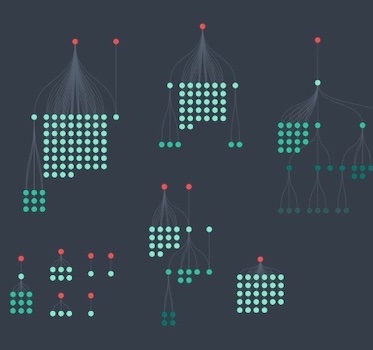
Layouts for large network visualization
Dan Williams Head of Product Management
5th April, 2022 | 9 min read
Large network visualization is no problem for our toolkits! We used two of our favorite layouts to map out a...
Product updates: stacking and sorting sequential layouts
Dan Williams Head of Product Management
15th March, 2022 | 2 min read
By popular demand, KeyLines 6.9 and ReGraph 3.6, our graph visualization toolkits, give you even more control over...
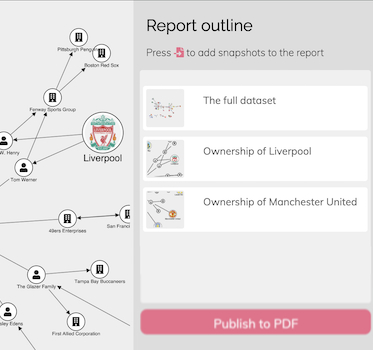
Intelligence dissemination made easy with PDF exports
Dan Williams Head of Product Management
1st March, 2022 | 9 min read
We use our graph visualization toolkits to publish a PDF report based on multiple snapshots of interactive graph...