This word means the tendency to forget names. This is something I’ve struggled with a LOT in recent years. I’m not sure what the cause is: the fact that my jobs at YOW and AWS meant meeting so many people? Did I get long Covid? Or is it one of the many joys of perimenopause? Or maybe it’s just getting older… At any rate, it’s incredibly frustrating to be able to picture someone or something, to know you know the name, and just not be able to grasp it.
I’ve been on a real gaming tear this year. Back in January I wrote about Dave the Diver and Unpacking, and I thought I’d mention a few more Nintendo Switch games that I’ve been playing lately and really enjoyed:
- Yoku’s Island Express – Rodd found this one recommended on Reddit for people who like no-stress platformers. You play a little bug postman who pushes a ball around an island, and it’s like a platformer crossed with pinball, two things I LOVE. The artwork and world building is really cool too.
- Steamworld Dig 2 – Another fun platformer where you play a little robot exploring a (mostly) underground world, digging minerals and trying to solve a mystery. There were one or two places were I got stuck and had to look up how to solve something, but I managed to defeat the end boss today all on my own. Good times!
- Palia – Anybody else playing this? I literally just rolled a character tonight. I’ve heard good things about it…
We also spent some time playing Breath of the Wild (a friend lent it to me) and I can see why it won so many awards. It just wasn’t for me, though. I struggled with all the different mechanics, and every time I picked it up I had to relearn how to do everything. There was just too much. I like something a bit more casual and low stress. If you’ve got recommendations, please share them!
For the past month, I’ve been establishing a new nightly routine. First, at 10pm I have an automatic reminder to write a journal entry. I’ve been using the iOS Journal app for this, which allows me to easily incorporate photos and maps from the day. I haven’t been using any of their prompts, but rather just jotting down what I did. I like being able to look back at everything I’ve done.
And then come the puzzles! Nothing like a little brain exercise to close out the day.
- Both Rodd and I do the NYT Connections. Maybe this is a humblebrag, but I’m always surprised when I see people complain that it’s hard! We’ve actually been challenging each other to find the purple category earlier rather than leave it to last.
- We also both do the five different daily puzzles over at Word Nerd. I’ve only managed to get all 23 Words like twice, and most days I struggle to hit 10. Rodd’s much better than me at that one! Maybe I’d have better luck earlier in the day with some caffeine in me. We also compete to see who can do the shortest Word Chain.
- I do the Daily Waffle and Waffle Royale (and every now and then the Deluxe Weekly Waffle). These are Scrabble-style letter tile switching games, with a fun mechanism that highlights when letters are correct or jumbled up.
- Rodd likes the OEC’s Pick 5 and Tradle games. These are where you have to identify which countries export certain goods. He’s really good at them both, but he thinks the Pick 5 is more fun.
Have you got any fun puzzle recommendations for us?
When I was working full-time, I was fortunate in that my Australian employer had a generous mobile phone benefit. To maximise that, I did what most of my colleagues did – go to the nearest Telstra store and get a handset with the biggest plan that came under the cap. Now that I’m not working, I have to pay my own bills… and I know the Telstra plan is massive overkill for what I actually use. So I called them up, found out cost to pay out the rest of my contract, and worked out that it would be far more effective to switch over to a pre-paid 12-month Boost SIM. It uses the Telstra network and for $230 you get 170GB of data, unlimited Australian calls and texts, as well as unlimited calls to the US. I bought one of the SIMs at Coles and was able to port my number over and be up and running in less than an hour.
 HOWEVER! I did have one issue with my iPhone, and I thought I’d mention here in case it helps someone else. See my Settings here? Even after my existing number was ported, the Mobile settings still showed the phone number that came with the SIM (that +61 6… one). It wasn’t a huge problem; I double-checked by calling and SMSing Rodd that my ported number was being used correctly. It did screw up iMessage and FaceTime though, as my ported number wasn’t listed as an eligible Receiving option. I tried changing it (both in Settings -> Mobile and also Settings -> Phone -> My Number) but it wouldn’t save. I restarted the phone multiple times. I contacted Boost, who couldn’t see any issue on their side. The agent said he thought that something was just cached, and it would eventually fix itself. But it stayed that way for weeks… until I finally figured out the solution myself.
If you find yourself in the same situation, just go to Settings -> General -> Transfer or Reset iPhone. Click the Reset button (a bit scary, I know!) and then the “Reset Network Settings” option. It’ll ask you to confirm before it does it. And that fixed it! My ported number was finally showing for the SIM, and I was able to add it back to iMessage and FaceTime.
(And if you’re curious about the overseas SIMs showing there, those are eSIMs that I use when travelling. I’ve been using Airalo for my overseas data needs for the past couple years and I’m very happy with them. Much cheaper than paying Telstra’s $10/day charge!)
Friday night fun: watching a 90min documentary on “The Oregon Trail” educational video game. (I’m not even kidding. This was a massive nostalgia trip for me and I learned heaps about the Minnesota tech industry in the 70s and 80s.)
* Trivia – The phrase “You have died of dysentery” never actually appears in the game!
This is fascinating. I also really like the way they explain it, which makes it super clear and easy to understand!
One of the hardest skills for new knitters to master is recognising and fixing errors. If you catch something quickly, you may be able to just un-knit (or “tink“) the last few stitches and fix it. But if you spot it a few rows later and you can’t face the thought of tinking all those stitches, you’ve really only got a few options: you can pull the needle out and rip several rows, but then you’ve got to pick all the live stitches back up. This can take a while, and depending on how thick/thin and fuzzy/smooth your yarn is it can be a real chore. (If you’re knitting anything complicated like lace where you have a high change of screwing something up, it’s highly recommended to put in lifelines every so often.) The other commonly used option is the nuclear one – ripping out the whole project and starting over. If you’re near the beginning, this may well be the fastest method.
But there is another way. Let me illustrate.
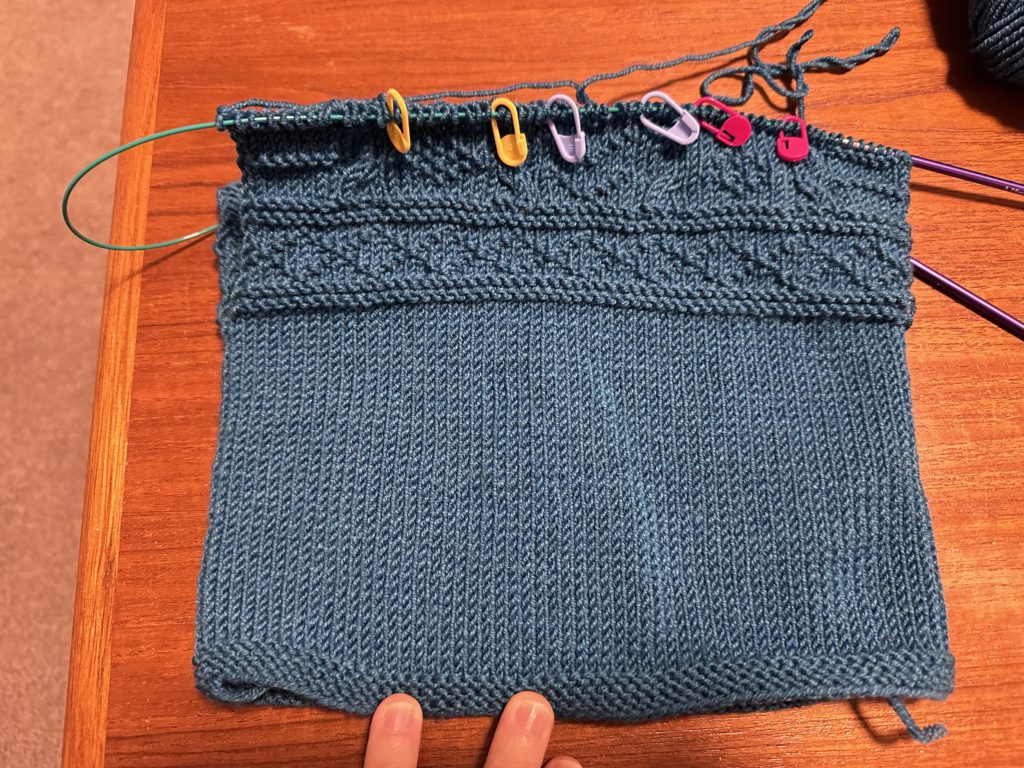
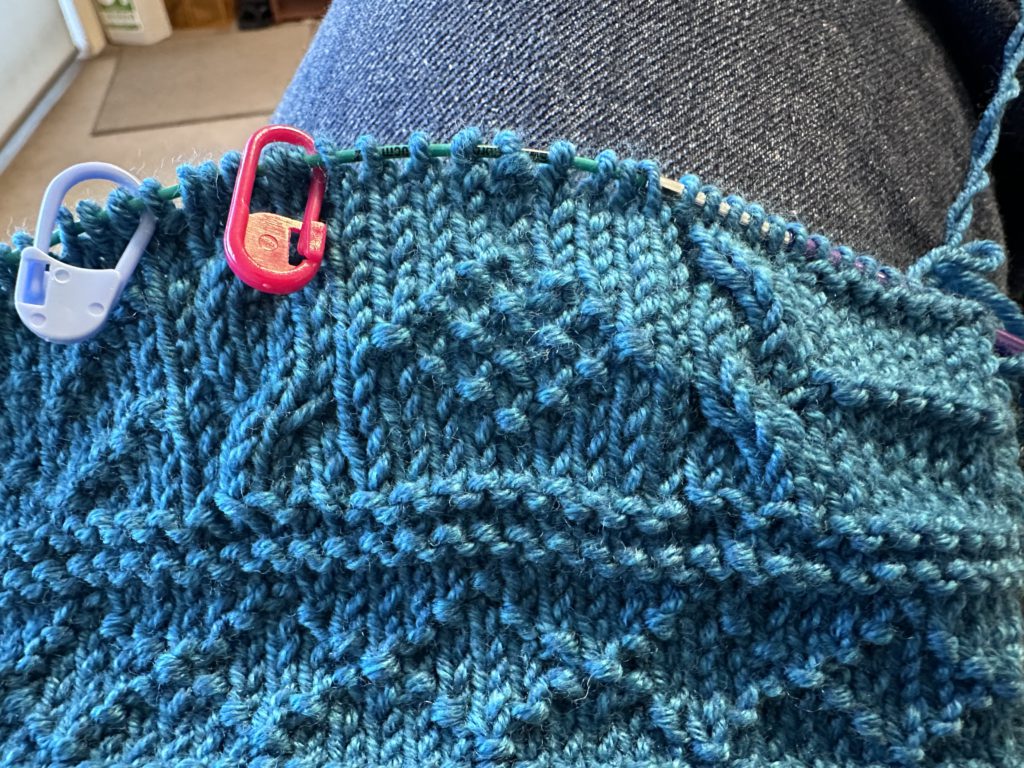
I spent a big chunk of hours yesterday working on a baby sweater. The body is stocking stitch, and then the top half has a pattern with columns of cables and garter stitch motifs. Here’s the photo I took at the end of the day:
When I was looking at the photo, I suddenly realised I’d screwed up one row of the pattern. Can you spot the mistake? Here I’ve isolated the two diamond motifs, outlined by the yellow and red stitch markers:
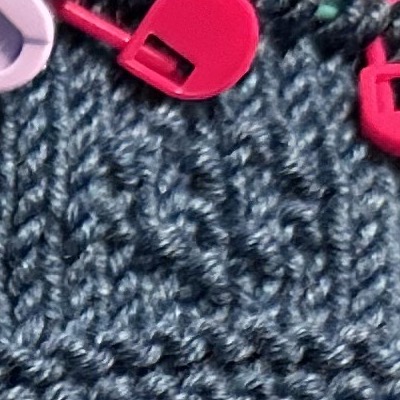
Even if you’re not a knitter, you can probably spot that they don’t match. I’ve somehow missed 4 purl stitches right through the middle of the motif on the right, which include the points at either side of the diamond.
The error occurred like 8 rows back, and while this yarn (Morris & Sons Empire 8ply in Aquamarine) would be relatively easy to pick up if I frogged those rows, reknitting the motifs would be a pain… and I’d be just as likely* to make a mistake again. So I decided instead to use the surgical method of dropping just the columns of stitches with the missing purls to correct them.
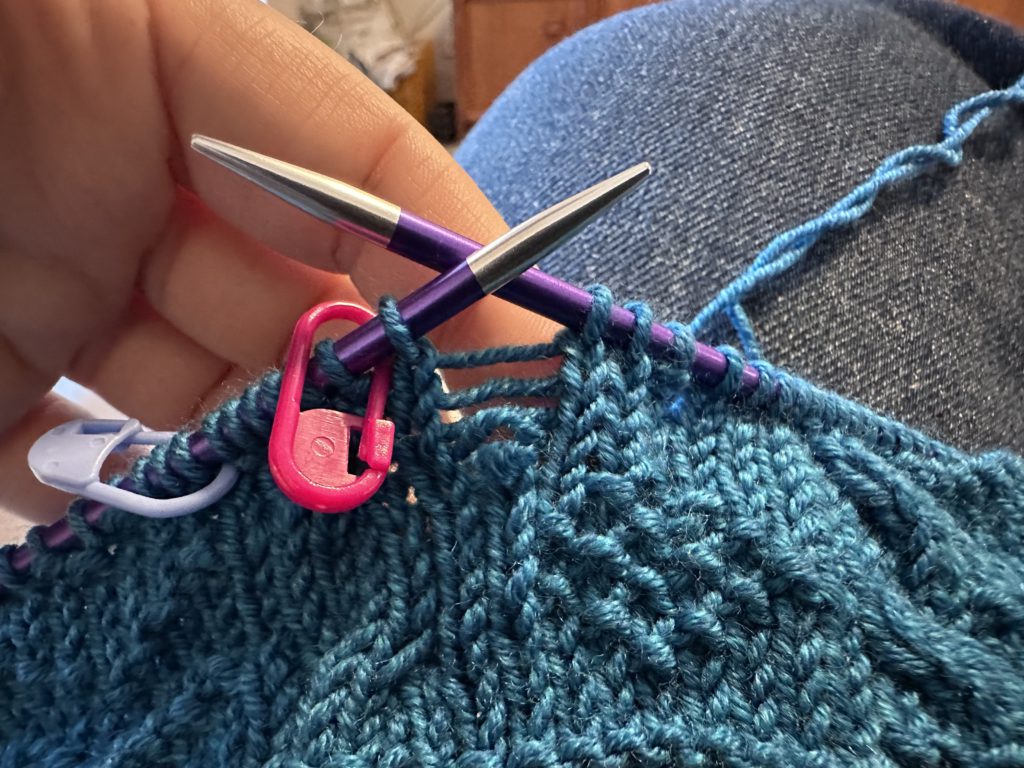
I don’t think this technique has a pithy name like tinking or frogging, but it’s often called “laddering down”. To illustrate, I’ve fixed 3 out of the 4 missing purls already and this photo shows me ready to correct the last one, the missing point of the diamond on the left. I’ve highlighted it in yellow. That knit stitch (looks like a V) should be a purl (looks like a horizontal bump). I’ve also shuffled my stitches around so that the column of stitches with the error is at the end of my left needle.
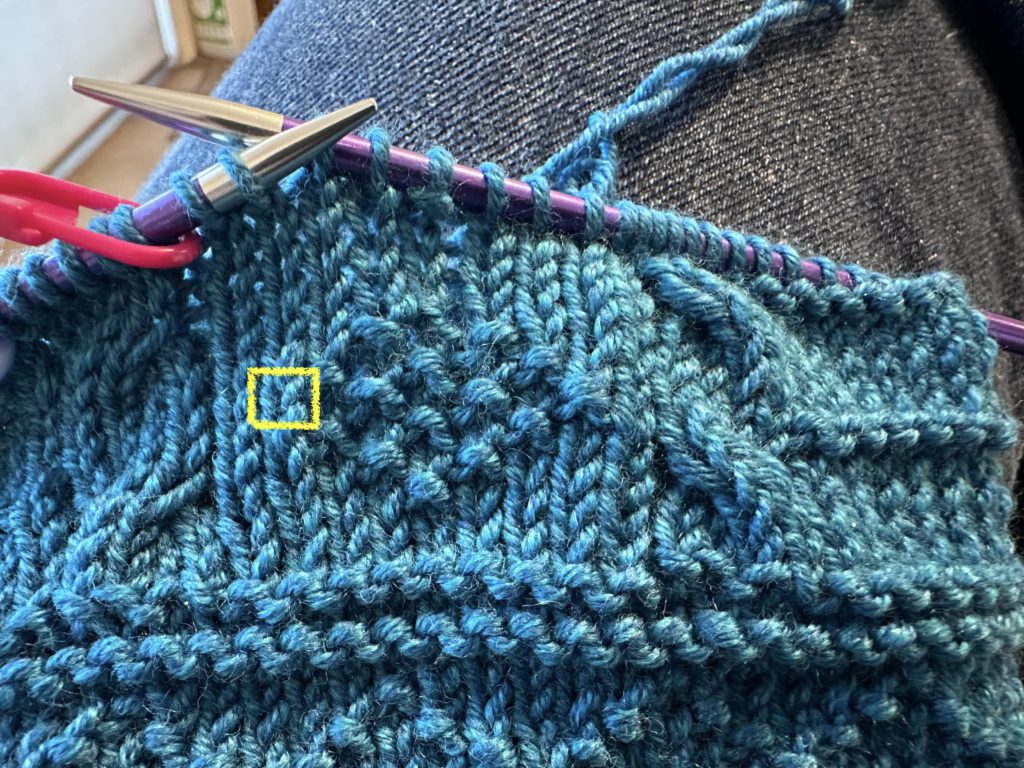
Now it’s time to drop that stitch and allow it to “ladder down” to the spot of the error. (It’s called laddering because each row you undo leaves a horizontal bar.) This wool likes to stick to itself, so I encouraged it where needed with the use of a spare needle.
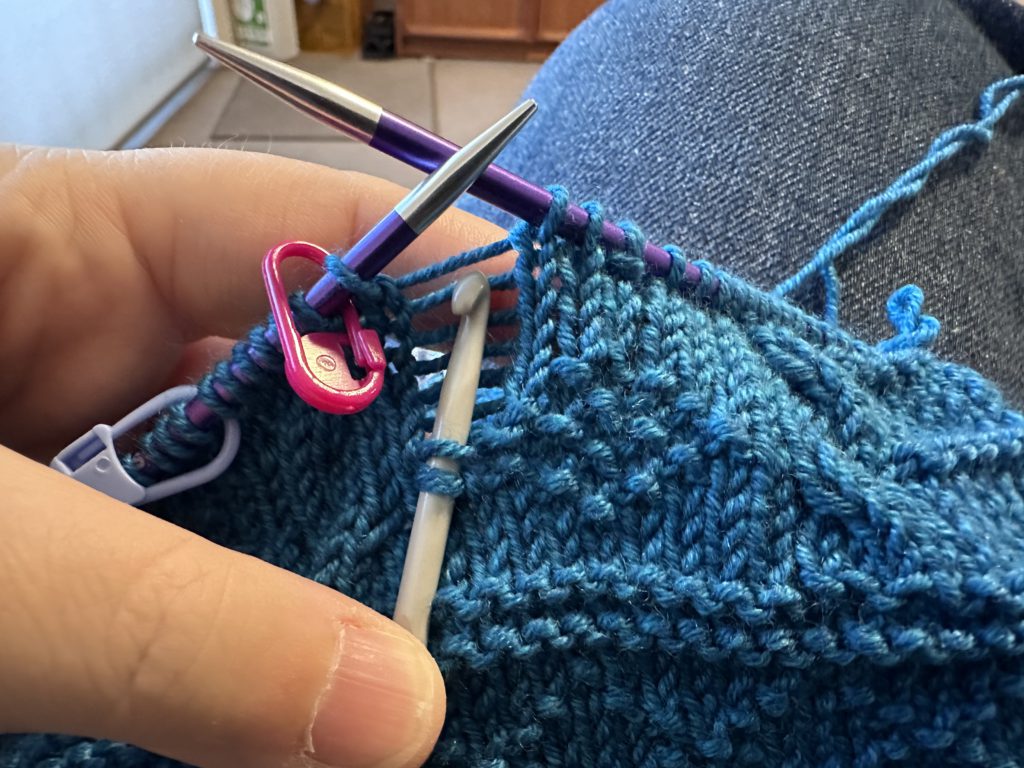
And here it is, down to the spot of the error. I’ve caught the live stitch that needs to be fixed with a crochet hook.

Now it’s just a matter of changing this knit to a purl, and then working my way back up the ladder again. For each stitch, you pull the lowest rung of the ladder through the current live stitch. For knits, you go in from the front and pull the ladder through from the back. For purls, you come in through the back and pull the ladder through from the front. You can use spare needles for this, but a crochet hook makes it really fast. (The photo below looks like I’m about to knit the stitch, but rest assured I moved the hook around to purl instead.)
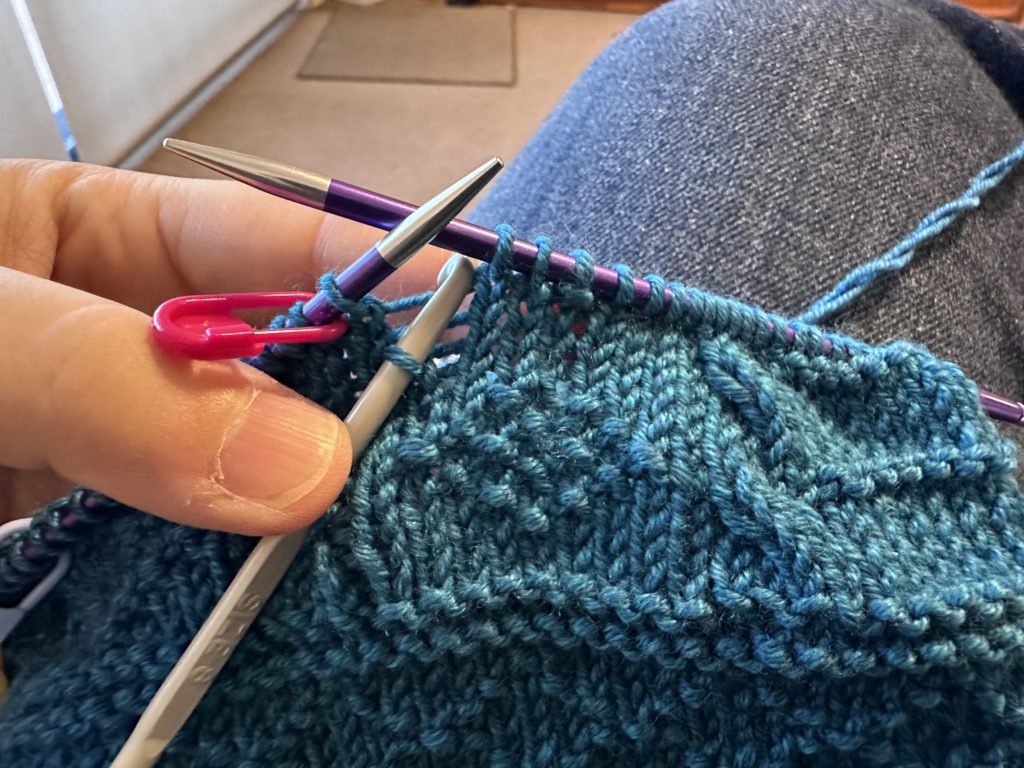
Here it is halfway along, showing the corrected purl and then the column of knit stitches above:
I made a short video showing the last couple stitches:
And here’s the completed motif after the repairs:
The only tricky bits are making sure you don’t drop down too many rows, and ensuring you don’t skip any rungs of the ladder on your way back up. I’ve even used this method to fix miscrossed cables! (Just drop down all the cable stitches, catch the live stitches on a spare needle, rearrange them correctly for the cross, and then ladder each one back up.) This technique can result in some wonky tension either side of the repaired column of stitches, but I find that a couple tugs on the work will fix it (and it’ll resolve itself during blocking anyway).
Much faster than tinking or frogging!
* The reason I made the mistake is that the damn pattern is an older one and it’s written out row-by-row without a chart. A chart would have taken up way less space and allow me to visually check for errors must easier. 😠 But this is something I’ve ranted about in the past…
From Metafilter I discovered this long retrospective on the Breeders and consequently went down a rabbit hole reading about the lineage from Throwing Muses to the Pixies to the Breeders and then Belly. I was a latecomer to these groups, getting first into the Breeders thanks to Last Splash and then moving on to Belly. I can remember driving home with my sister after high school tennis practice, belting out Belly’s King along to my car’s crappy cassette player…
A lovely little video of the Breeders performing some of my favorite songs – mostly acoustically – among the redwoods in Big Sur.
Still can’t believe I sold them craft supplies 14 years ago without realising who they were. 😂
If you have a coffee machine, you probably want to watch this video, even if you think you already know how to do the required maintenance.
In totally unrelated news, Rodd has spent the last hour cleaning his coffee machine. 😜