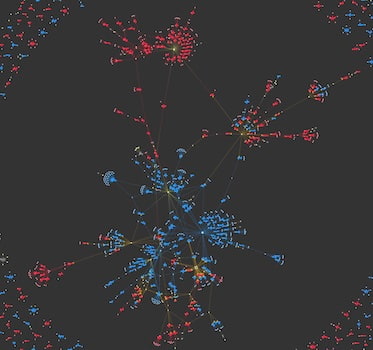
Surprising visual insights from US election campaign data
Corey Lanum Chief Product Evangelist
31st October, 2023 | 6 min read
I use graph visualization to reveal insights in US election campaign data: which orgs donate to both Republican...
Corey Lanum Chief Product Evangelist
31st October, 2023 | 6 min read
I use graph visualization to reveal insights in US election campaign data: which orgs donate to both Republican...
Corey Lanum Chief Product Evangelist
19th October, 2023 | 12 min read
If you’ve found this article, the chances are you: Need to build a powerful graph or graph analytics application...
Rosy Hunt Content Marketing Specialist
5th October, 2023 | 2 min read
Artificial intelligence promises a positive shift in practice for businesses across domains from cybersecurity,...
Catherine Kearns Content Strategist & Team Lead
3rd October, 2023 | 3 min read
Our free, downloadable buyer’s guide and comparison template helps you to decide which graph visualization...
Julia Robson Software Developer
28th June, 2023 | 10 min read
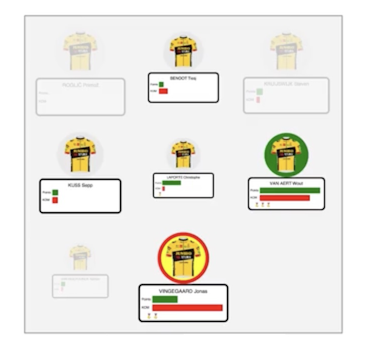
On Saturday 24th June 2023, I set off from Bilbao, Spain, to ride the Tour de France route with Le Loop. In the...
Corey Lanum Chief Product Evangelist
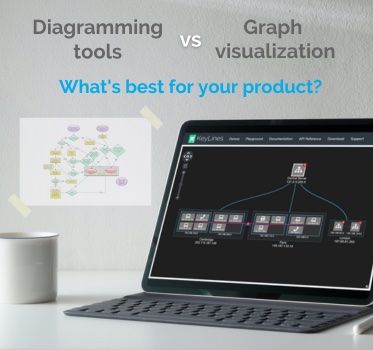
31st May, 2023 | 5 min read
When diagramming tools aren’t working hard enough for you, it’s time to upgrade to the insightful...
Noah Stapleton Sales Manager
9th May, 2023 | 11 min read
How do senior management teams prioritize cyber threat detection? We look at key trends from the latest reports,...
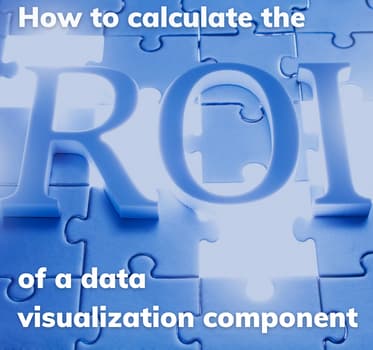
Corey Lanum Chief Product Evangelist
25th April, 2023 | 10 min read
How do you measure the value of adding data visualization to your web app? If you choose to build a visualization...
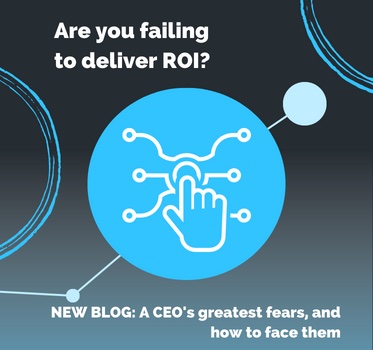
Christian Miles VP of Sales
29th March, 2023 | 13 min read
If I were to write about every challenge facing senior managers in the tech industry right now, this article would...