Data visualization use cases
How our technologies help make sense of complex connected data
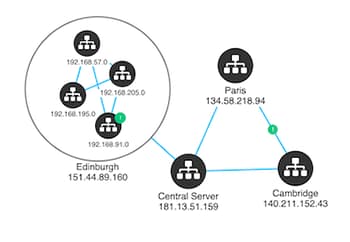
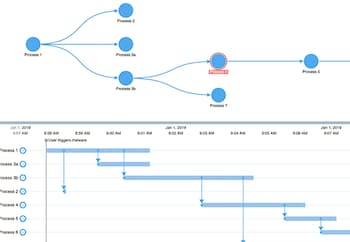
Understand cyber threats, reveal network vulnerabilities, detect malware and discover trends using visualization techniques.
One of the first graph visualization use cases – uncovering threats and critical intelligence to help make the world safer.
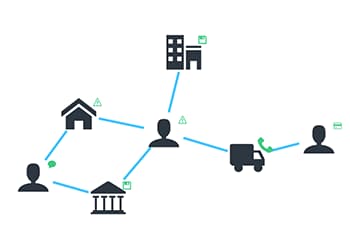
Visualize unusual activities and connections to identify, investigate and predict any type of fraud – from identity theft to financial crime.
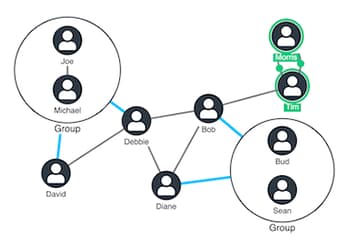
Reveal connections, understand patterns, predict behaviors and gain insight that can prove, solve or prevent crime.
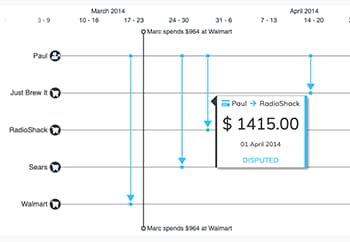
Comply with regulatory laws and legislation by visualizing complex transaction data to spot patterns and anomalies.
Clarify complex and dense blocks of transaction data to identify high-risk activity
Consolidate data from across the enterprise into a single unified view that turns information into insight.
Make sense of complex connected data to make new discoveries, understand the competition and unify enterprise knowledge.
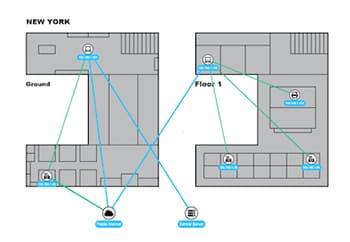
Create interactive visualizations of infrastructure networks, get alerts, discover bottlenecks and manage vulnerabilities.
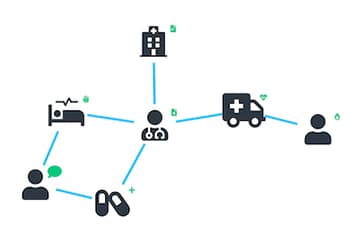
Visualize and analyze connections between chemicals and effects, agents and diseases, drugs and market opportunity.
Understand customer behavior to increase profits, cut costs, provide a better service and make clearer predictions.
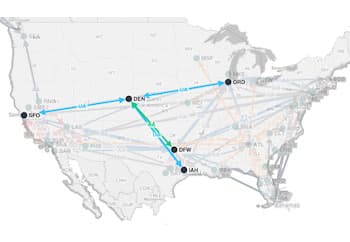
Explore your supply chain data to uncover inefficiencies, manage regulatory compliance and find new ways to innovate.


