Data visualization for fraud detection tools
The fraud detection visualization challenge
Fraud is an expensive and complicated problem. To detect and investigate it effectively, you need to see connections – between people, accounts, transactions, and dates – and understand complex sequences of events.
That means analyzing a lot of data.
The challenge is complicated further by fraudsters’ fast-changing tactics and strategies. As their crimes become more sophisticated, so too must the analyst’s data visualization and fraud detection tool.
Known and unknown fraud
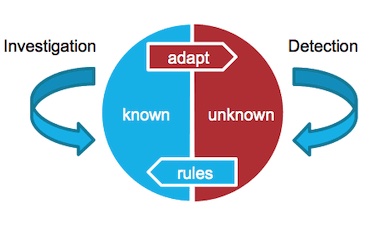
To stop fraud, analysts look for two types: known and unknown fraud.
As the name suggests, ‘known fraud’ is fraudulent activity that has been encountered before and can be automatically detected with rule-scoring and pattern matching tools. In this scenario, data visualization is an investigative tool providing the accurate situational analysis needed for fast go/no-go decisions.
Unknown fraud is fraudulent activity that has not been seen before. It’s likely to go under the radar of automated fraud systems, so data visualization becomes a powerful fraud detection tool.
Let’s look at some examples.
Investigating known fraud
Fraud analysts have 2 priorities when working with known fraud: speed and accuracy.
They often have just a few minutes to approve or deny a case. Making fast decisions with confidence is essential. Clear, powerful and interactive visualization makes this possible.
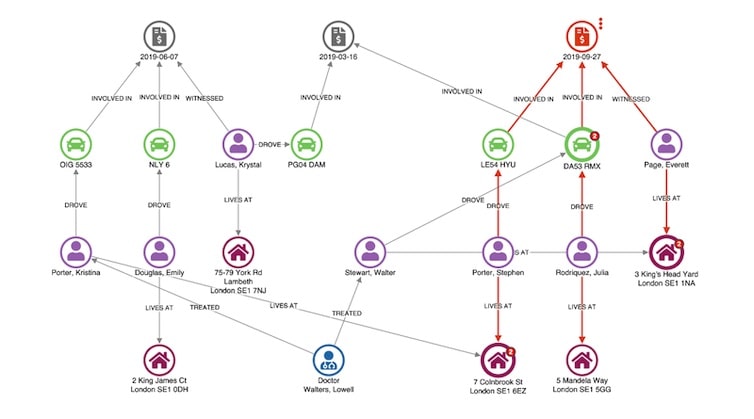
Link analysis transforms complex scenarios into simple, intuitive views that can be quickly understood. The data in this example represents an insurance claim, showing policies, claims, claimants, vehicles, witnesses and doctors.
An unusual connection stands out right away: the witness, Everett Page, shares an address with Walter Stewart, who has a previous claim relating to the same vehicle involved in this incident.
This is enough for the analyst to flag this claim for deeper investigation.
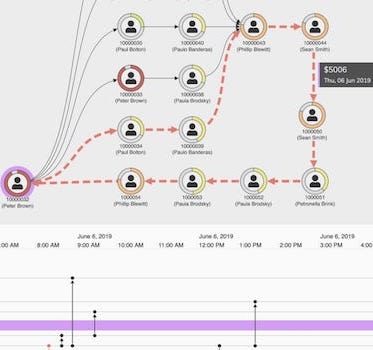
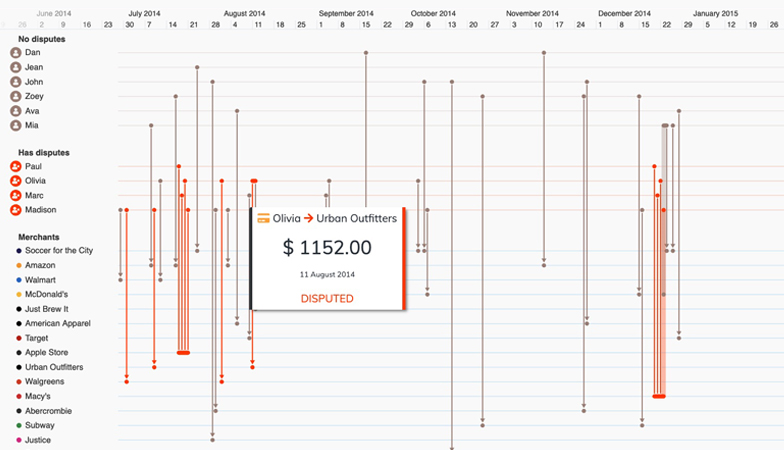
Timeline visualization adds a time dimension, making it easy to understand the sequence in which events unfolded.
This dataset contains a record of credit card transactions. We can easily pick out those which are disputed (in red) and identify the patterns around them.
Fraud management white paper
How data visualization powers a better fraud detection tool
Detection tools for unknown fraud
We’ve seen how known fraud involves investigating specific cases. To detect unknown fraud, we need a wider view of data.
Combining powerful link analysis and timeline visualization with their own domain knowledge, fraud analysts can quickly learn which patterns are normal, and which need to be investigated.
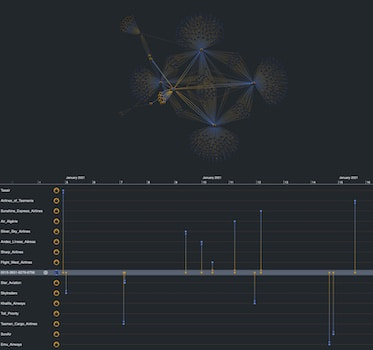
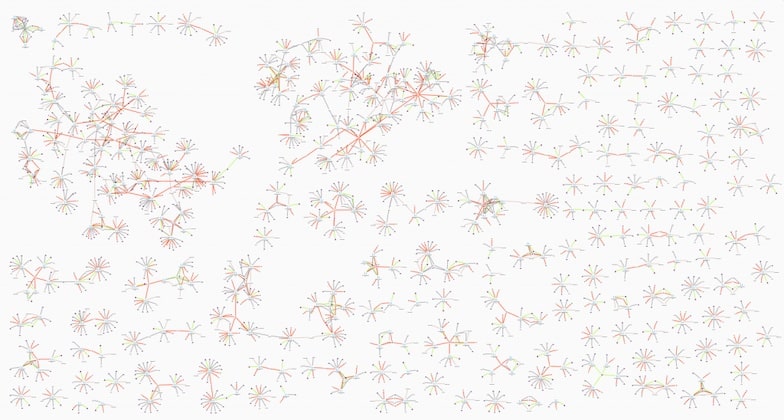
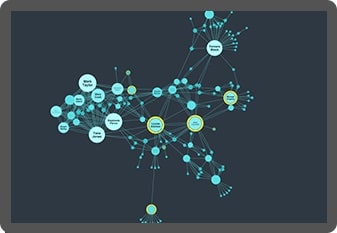
Here we’re looking at 24 hours of insurance claims. Some visual patterns indicate business as usual. A standard claim has a star shape – with a central case with a small number of policies, individuals and other identifiers.
However, we can also see some densely-connected areas that show unusual connectivity. An analyst would explore this in more detail, using investigative techniques to understand the behaviors involved and whether or not it conceals fraud.
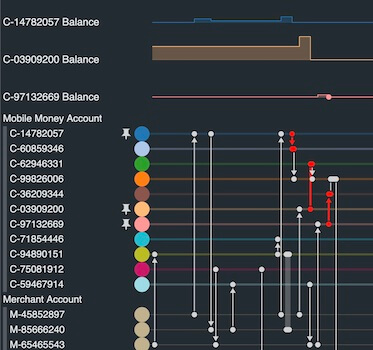
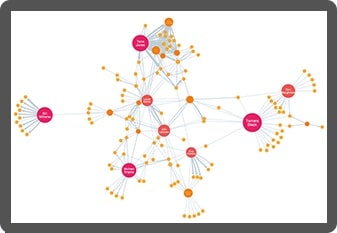
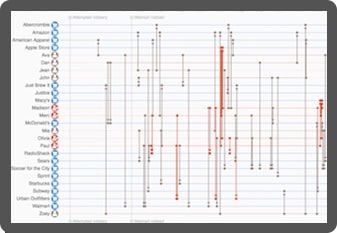
Here’s an insider trading investigation into share transactions.
Timeline visualization makes it easy to see how the relationships between traders developed through time.
We see Shany Keebler buying shares just before a big profit announcement. Combine that with communications data and unusual patterns start to emerge.
Customize your fraud detection tool
Organizations worldwide trust our link analysis and timeline visualization technologies to join the dots in their fraud detection and investigation processes. Here’s why they choose us.

See the full picture
Interact with data from across the organization in a single chart. Our products’ flexible approach means you can overcome data silos and gain insight into fraud information from multiple sources, giving you a clearer, more complete picture of events.

Visualization that scales
Our toolkits support fraud analysis at scale. Whether that means you’ve got a large and distributed team, or huge volumes of data to analyze, we’ve designed our products to scale-up to any size organization and operation.

Get answers faster
Discover more intuitive ways to understand your fraud data. Timeline and link analysis tools reveal fraud insight more effectively than other automated or manual processes, leading to faster and better decisions and fewer missed incidences of fraud.

A custom fraud detection tool
Visualization tools, custom designed for your fraud analysts and the data they need to understand, empower anyone to find insight in complex data. The result: insightful and straightforward tools that people want to use.
Want to try it for yourself?
KeyLines
Graph visualization for JavaScript developers
Code how you like and build link analysis apps that work with any stack.
ReGraph
Graph visualization for React developers
Use a simple data-driven API to build customized graph visualization apps in React.
KronoGraph
Timeline visualization for JavaScript or React developers
Design interactive timelines to explore patterns and unfolding events.